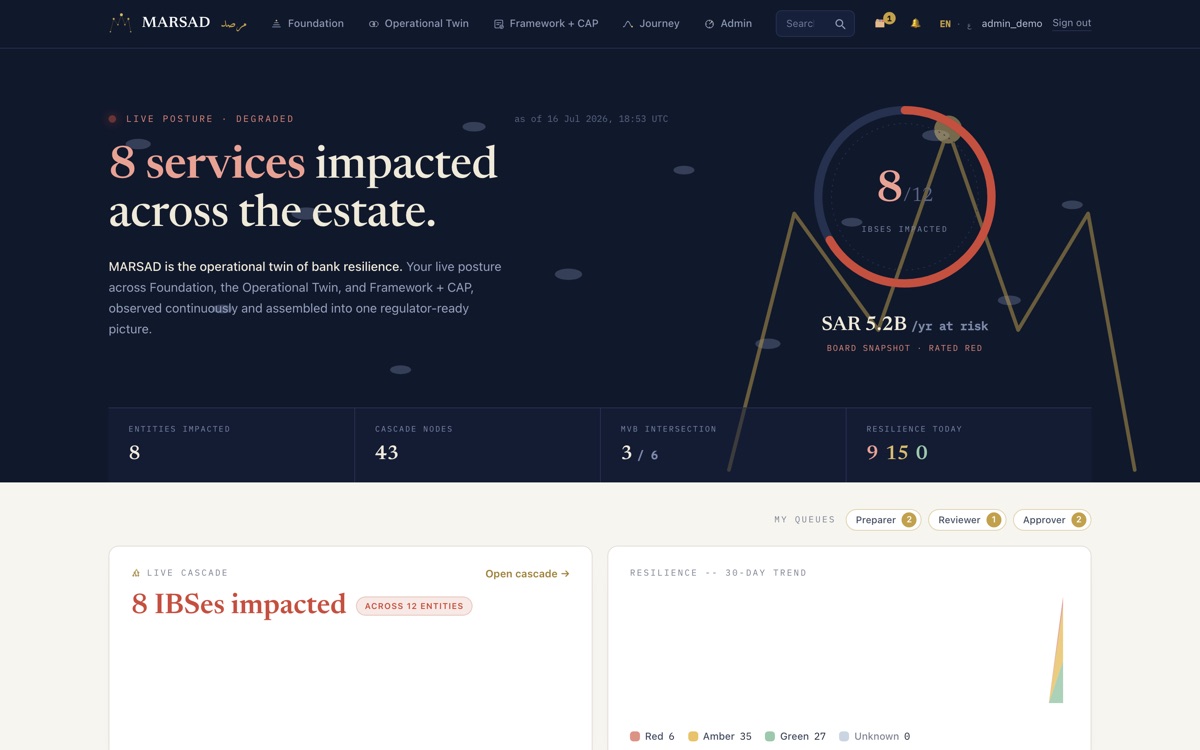
Home: the Observatory
Whole bank · live postureThe live posture headline, the IBS gauge, revenue at risk and the horizon strip, then the daylight cards: live cascade, 30-day resilience trend and the operator's own work queues.
VIEW FULL SIZE → DEMO 02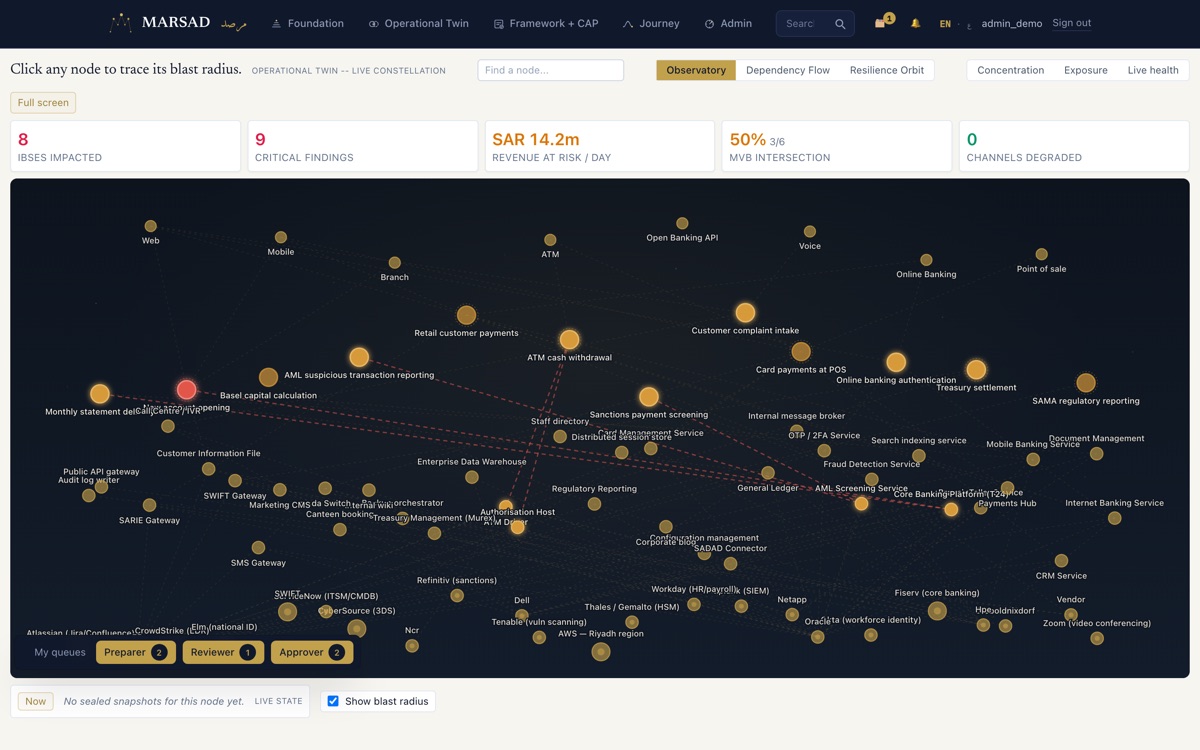
The Constellation
Operational Twin · dependency graphEvery channel, IBS, service and vendor as one living graph. Click any node to trace its blast radius; switch lenses between concentration, exposure and live health; scrub back through sealed history.
VIEW FULL SIZE → DEMO 03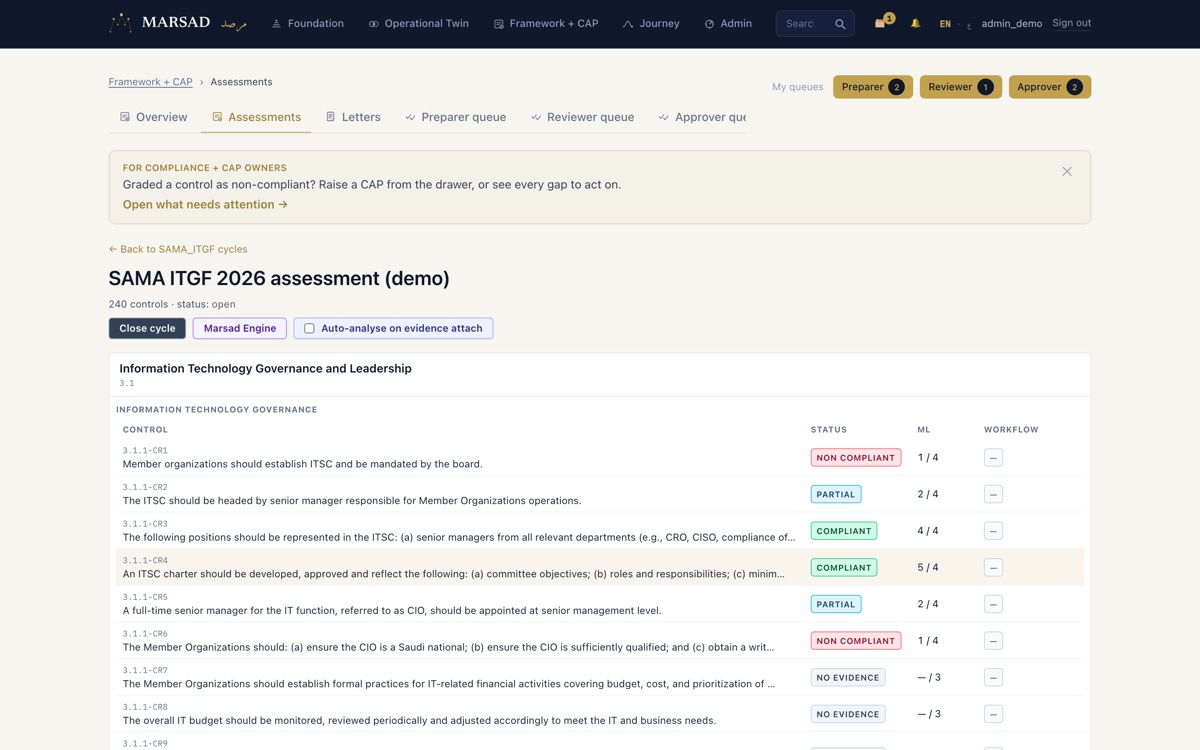
An assessment cycle
Framework + CAP · SAMA ITGFThe per-control grid for an open SAMA ITGF cycle: the regulator's own control text, compliance status, ML scores against target, the Marsad Engine one click away, and a raise-a-CAP path from every gap.
VIEW FULL SIZE → DEMO 04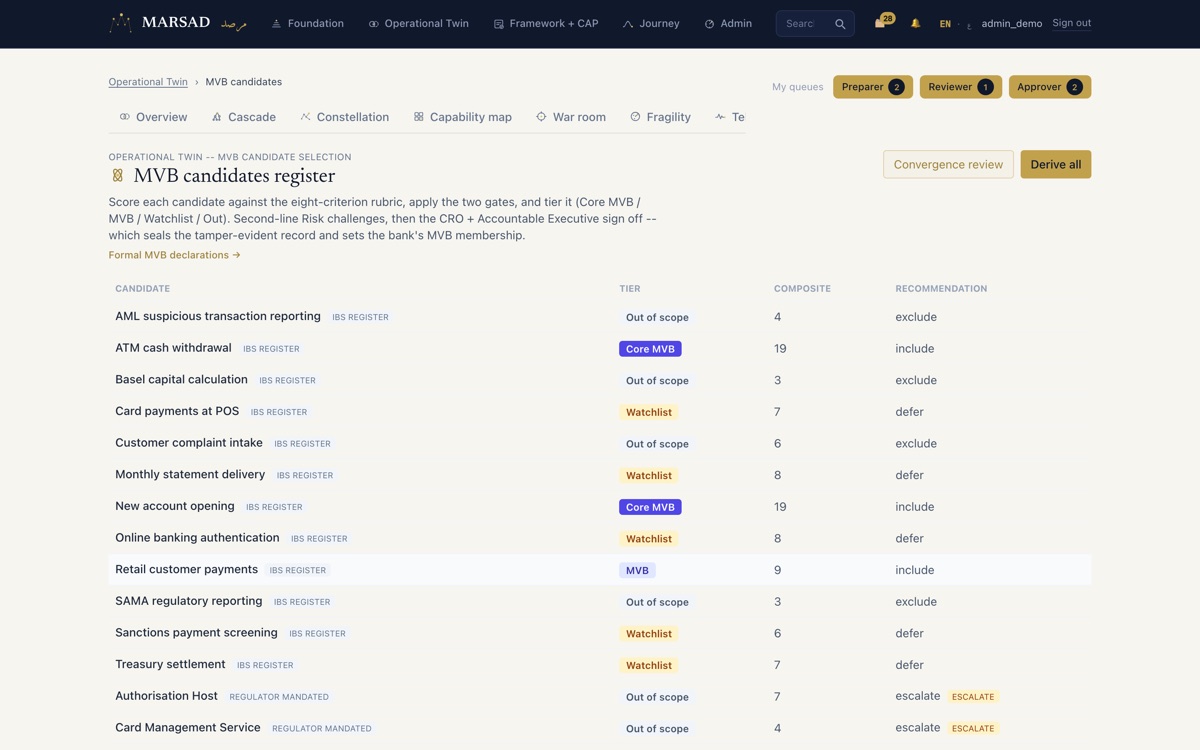
The MVB register
Operational Twin · candidate selectionThe Minimum Viable Bank register: each candidate scored against the eight-criterion rubric, gated, tiered, challenged by second-line Risk, and dual-signed by the CRO and Accountable Executive into a sealed record.
VIEW FULL SIZE → DEMO 05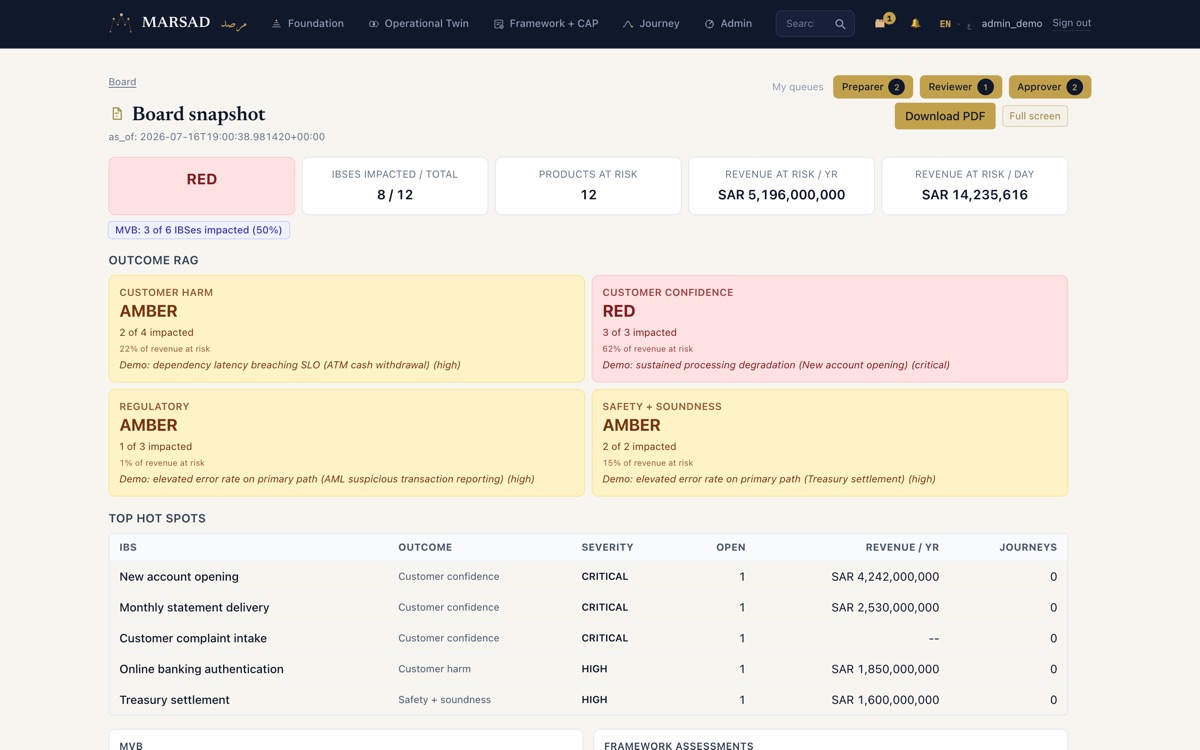
Board snapshot
Executive · one page, exportableWhat the board sees: overall RAG (revenue-weighted), the outcome quadrant, the hot-spots table with revenue at risk per IBS, and framework progress. The same shape the PDF renderer seals.
VIEW FULL SIZE →